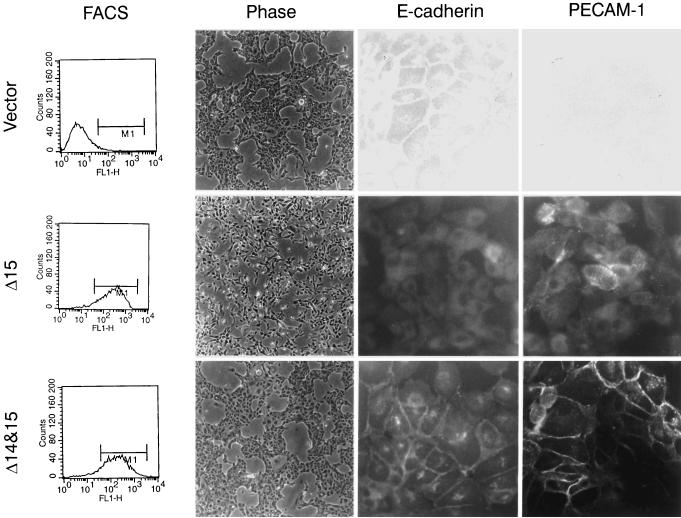
Figure 1.
Characteristics of MDCK cells expressing different PECAM-1 isoforms. MDCK cells were stably transfected with vector control, Δ15 PECAM-1, and Δ14&15 PECAM-1. Clones were isolated and characterized for expression levels of PECAM-1, their morphology, and E-cadherin and PECAM-1 localization. PECAM-1 expression levels were compared by FACScan analysis. The morphologies of cells are shown in phase micrographs (10× objective) of representative clones of transfected cells growing under normal conditions. Note that the Δ15 PECAM-1–expressing cells lack the closely packed epithelial morphology observed in vector control and Δ14&15 PECAM-1 transfected cells. The localization of E-cadherin and PECAM-1 was examined by indirect immunofluorescence (40× objective). Note the lack of E-cadherin and PECAM-1 junctional localization in Δ15 PECAM-1 transfected cell compared with Δ14&15 PECAM-1 transfected cells. The PECAM-1 transfected cells express similar levels of PECAM-1 on their cell surface.

