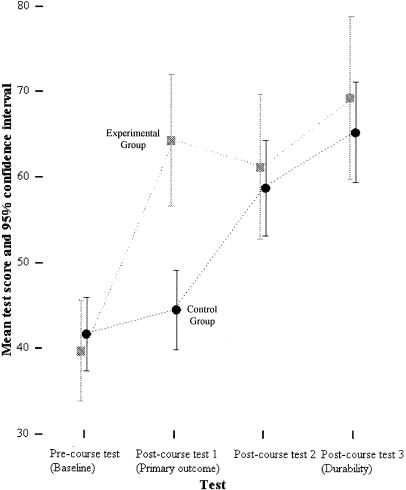
FIGURE 2.
Test scores for the precourse test and the three postcourse tests by experimental group. The gray squares represent the mean test scores in the experimental group for each test with 95% confidence intervals. The black circles represent the mean scores for the control group with 95% confidence intervals.

