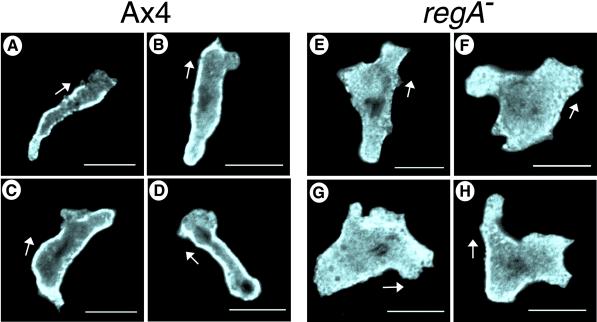
Figure 10.
Mysoin II distribution in representative Ax4 cells (A–D) and regA− cells (E–H) midway in the front of a simulated temporal wave of cAMP (the third in a series). Images were taken 0.4 μm off the substratum, using identical confocal scanning parameters for comparison. Small arrows indicate the polarity of the cell interpreted from the parallel DIC image of each cell. The scale bar represents 10 μm.

