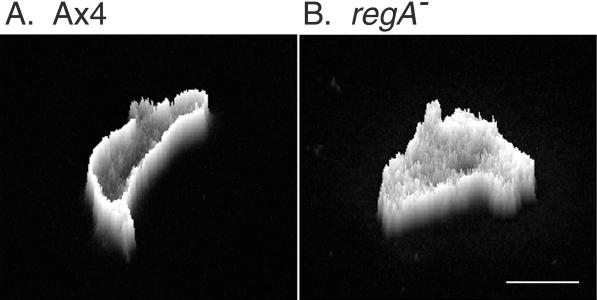
Figure 11.
A “pseudo-3D” projection in which the z-axis represents the intensity distribution of stained myosin II over the scanned area of a representative Ax4 (Figure 10C) and a representative regA− cell (Figure 10G) midway in the front of a simulated temporal wave of cAMP. Scale bar represents 10 μm.

