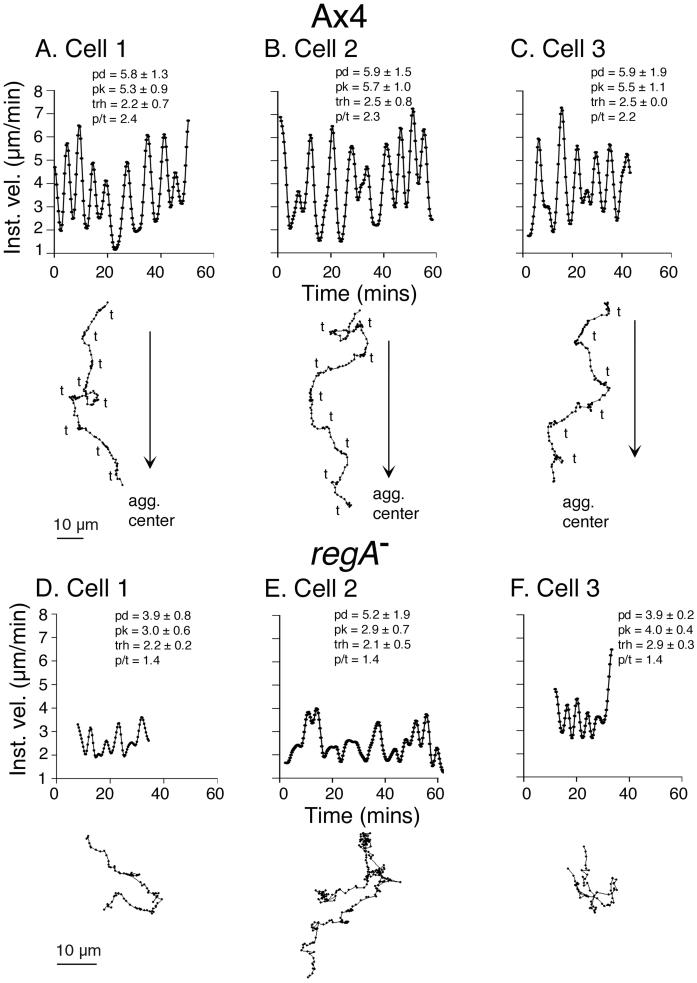
Figure 4.
Time plots of instantaneous velocity and corresponding centroid tracks of three representative Ax4 cells (A–C) and three representative regA− cells (D–F) responding to natural waves generated in their own homogeneous aggregation territories. Arrows along Ax4 centroid tracks represent the direction toward the common aggregation center (source of waves), and “t” represents the trough regions in the respective velocity plots. In regA− territories, there was no single direction reflecting the source of the wave, hence no arrows have been included in panels D–F. Pd, average period between velocity peaks; pk, average peak velocity; trh, average trough velocity; p/t, ratio of average peak to average trough velocities. Values are presented as average ± SD. Velocity plots were smoothed 10 times with Tukey windows of 10, 20, 40, 20, and 10.

