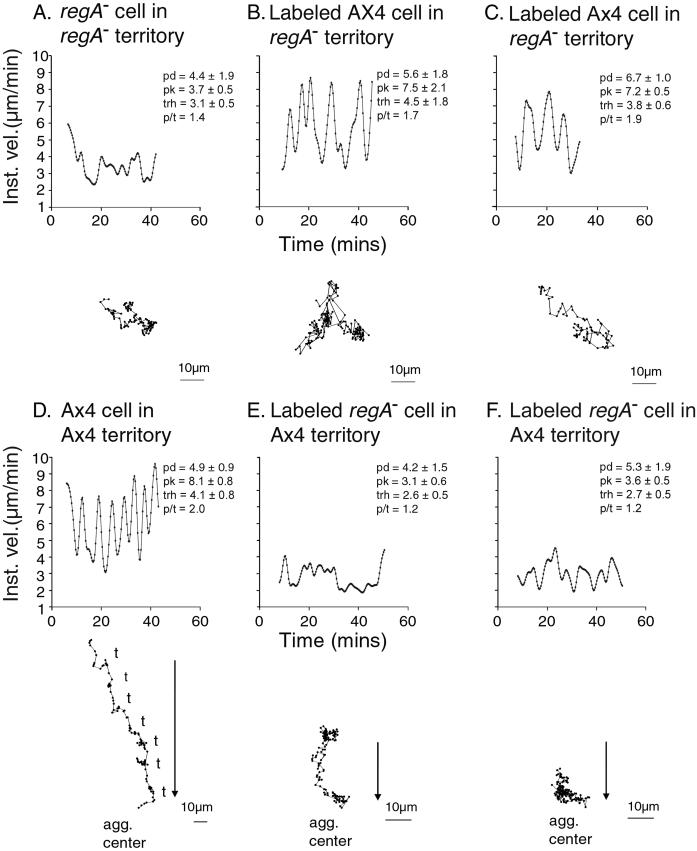
Figure 5.
The behavior of a representative unlabeled regA− cell (A) and two DiI-labeled Ax4 cells (B and C) in the same area of a developing regA− culture, and the behavior of a representative unlabeled Ax4 cell (D) and two DiI-labeled regA− cells (E and F) in the same Ax4 aggregation territory. Arrows in (D–F) indicate the direction toward the aggregation center (the source of waves) of the territory in which the three representative cells are located. pd, pk, trh, and p/t and the smoothing regime are described in the legend to Figure 3.

