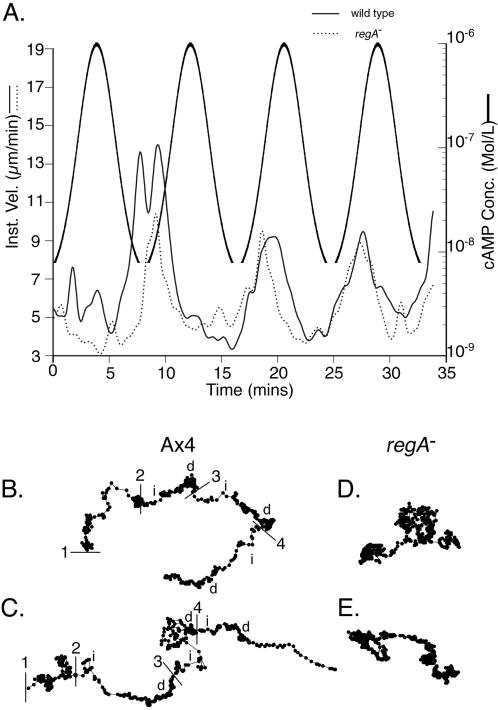
Figure 8.
The behavior of Ax4 and regA− cells in temporal gradients of cAMP generated in the absence of spatial gradients that mimic the temporal dynamics of natural waves of cAMP. (A) The average instantaneous velocity and estimated cAMP concentration are shown during simulated waves. Note that neither Ax4 nor regA− cells increase instantaneous velocity in the front of the first simulated wave (Varnum et al., 1985). Instantaneous velocity, measured at 1-min intervals, represents the average of 10 Ax4 cells and 10 regA− cells, respectively. (B and C) The centroid tracks of Ax4 cells responding to sequential simulated temporal waves of cAMP. (D and E) The centroid tracks of regA− cells responding to sequential simulated temporal waves of cAMP. 1, 2, 3, and 4 (in B and C), sequential wave number; i, increasing gradient; d, decreasing gradient. Velocity plots in (A) were smoothed 10 times with Tukey windows of 10, 20, 40, 20, and 10.

