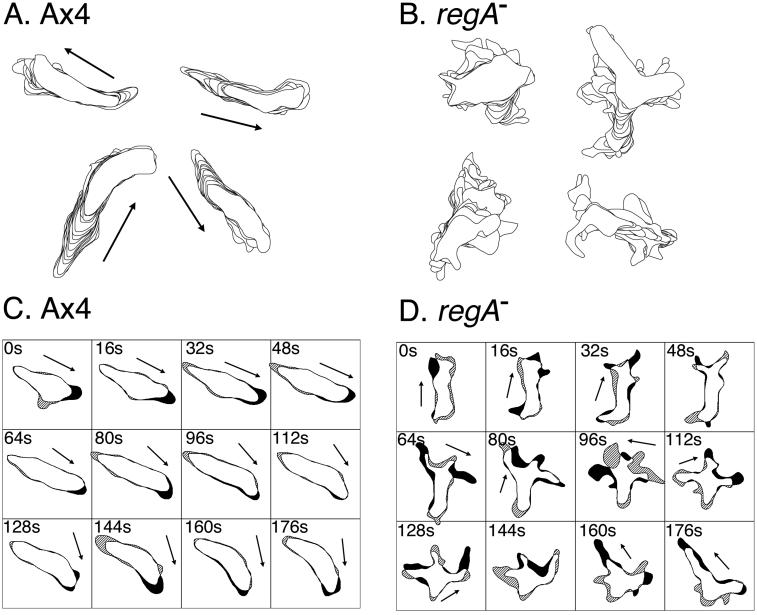
Figure 9.
Behavior of Ax4 and regA− cells in the first 3 min of the increasing phase of a temporal wave of cAMP that mimics the temporal dynamics of a natural wave of cAMP. (A and B) Perimeter tracks of Ax4 and regA− cells, respectively. (C and D) Difference pictures of a representative Ax4 and regA− cell, respectively. Black filled areas represent expansion zones, and hatched areas represent contraction zones of difference pictures. Arrows in difference pictures represent direction vectors drawn through the centroids of the earlier and later perimeter image in each difference picture.

