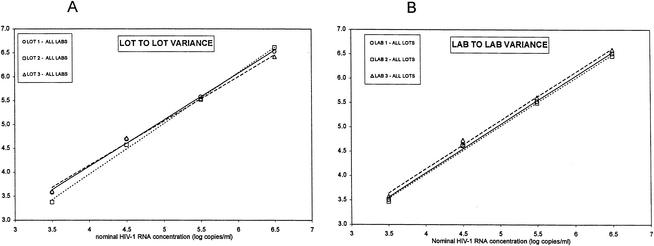
FIG. 3.
Linear regression analysis on the four mean observed concentrations generated by all three laboratories using the three specific lot numbers (A) and by all three lots at the three specific laboratories (B). Mean observed HIV-1 RNA concentrations (log10 copies per milliliter) (on the y axis) are depicted against nominal HIV-1 RNA concentrations.

