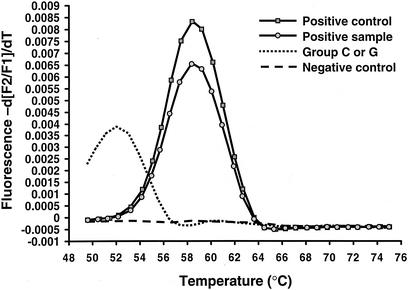
FIG. 3.
Melting curve analysis for LightCycler PCR assays. The designation −d[F2/F1]/dT on the y axis refers to the negative derivative of fluorescence. F2 is the fluorescence emission for the LC-Red640 fluorophore, and F1 is the fluorescence emission for the fluorescein fluorophore. The Tm of GAS by melting curve analysis is 57.3 ± 2.5°C. Large-colony-forming group C and group G streptococci of human origin, which have recently been classified as the same species (S. dysgalactiae subsp. equisimilis), produce identical melting curves, with a Tm of 51.5 ± 2.5°C, but are not detected during the real-time quantification portion of the PCR.

