Figure 1.
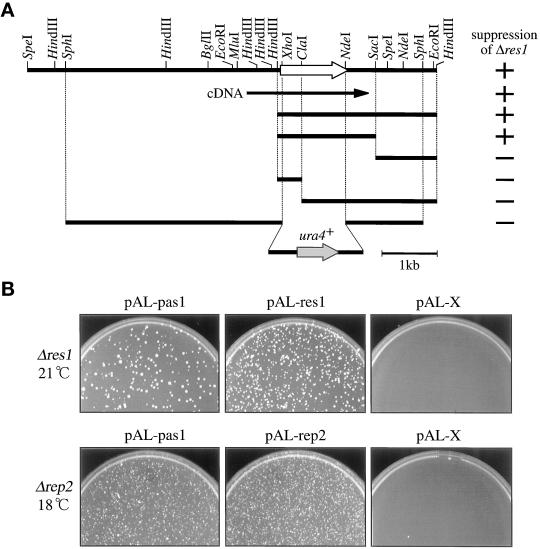
Isolation of the pas1+ gene. (A) A restriction map of the pas1+ gene. The white and black arrows indicate the direction and extent of the pas1+ ORF and the pas1+ cDNA, respectively. The ability of the subclones to suppress the Δres1 mutant is shown as + or − in the right column. The structure of the 7-kb SphI fragment used for the disruption of the pas1+ gene is shown at the bottom. (B) Suppression of Δres1 and Δrep2 mutants by overexpression of the pas1+ gene. The Δres1 (K156-D1) and Δrep2 (N3-141S) mutants were transformed with the indicated plasmids, spread on MMA plates, and incubated at the indicated temperatures. pAL-pas1 has an insert of the initially isolated 2.8-kb HindIII fragment. pAL-X is the pALSK+ vector with no insert and is used as a negative control.

