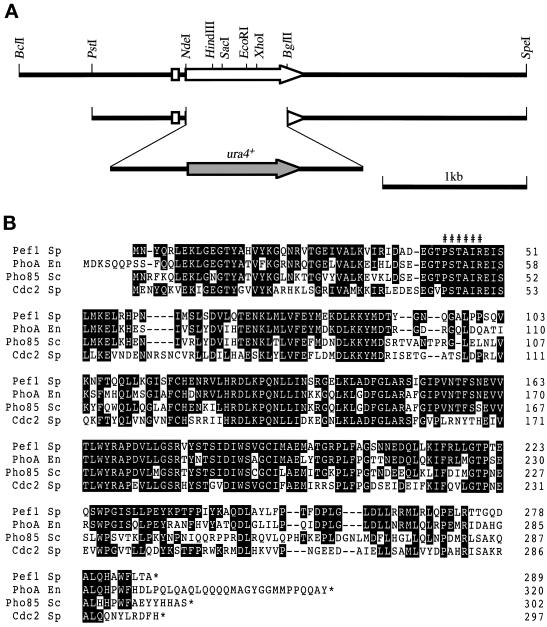
Figure 7.
Structure of the Pef1 protein. (A) A restriction map of the pef1+ gene. The white arrow indicates the direction and extent of the pef1+ ORF. The structure of the PstI–SpeI fragment used for the disruption of the pef1+ gene is also shown. (B) Amino acid homology among S. pombe Pef1p (Pef1 Sp), E. nidulans PhoAp (M47) (PhoA En) (Bussink and Osmani, 1998), S. cerevisiae Pho85p (Pho85 Sc) (Uesono et al., 1987), and S. pombe Cdc2p (Cdc2 Sp) (Hindley and Phear, 1984). Amino acids in which Pef1p is identical to the other three kinases are shown in black. ###### indicates the conserved PSTAIR motif.

