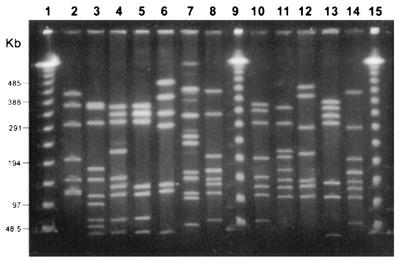
FIG. 4.
PFGE analysis of selected C. jejuni isolates after digestion with SmaI. Numbers at left indicate band size in kilobase pairs. Lanes 1, 9, and 15 contain lambda ladder (48.5 kb) for size estimation. Lanes 2 to 8 contain clinical isolates from outbreak-associated patients. Lane 2, PFGE type 1, which comprised 83% of the patient isolates; lanes 3 to 8, unrelated types (more than four band differences) and subtypes (three or fewer band differences) 2, 3, 3a, 4, 5, and 6, respectively. Lanes 10 to 14 contain patient isolates not associated with the outbreak.

