
Figure 1.
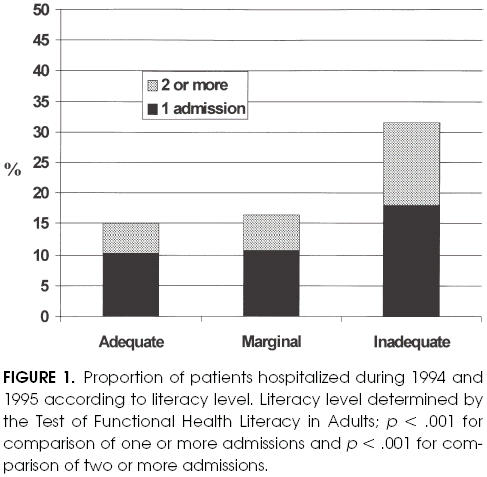
Proportion of patients hospitalized during 1994 and 1995 according to literacy level. Literacy level determined by the Test of Functional Health Literacy in Adults;p < .001 for comparison of one or more admissions and p < .001 for comparison of two or more admissions.