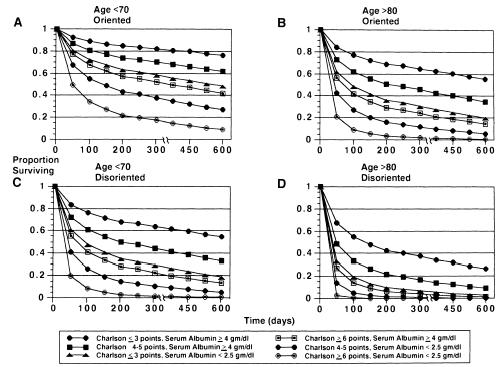
Figure Projected survival estimates based on the multivariable model. For all panels, curves represent combinations of Charlson comorbidity scores and serum albumin levels (g/dl): (A) age less than 70, and oriented to person; (B) age greater than 80, and oriented to person; (C) age less than 70, and disoriented to person; (D) age greater than 80, and disoriented to person.
