Figure 6.
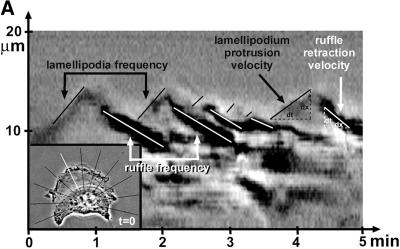
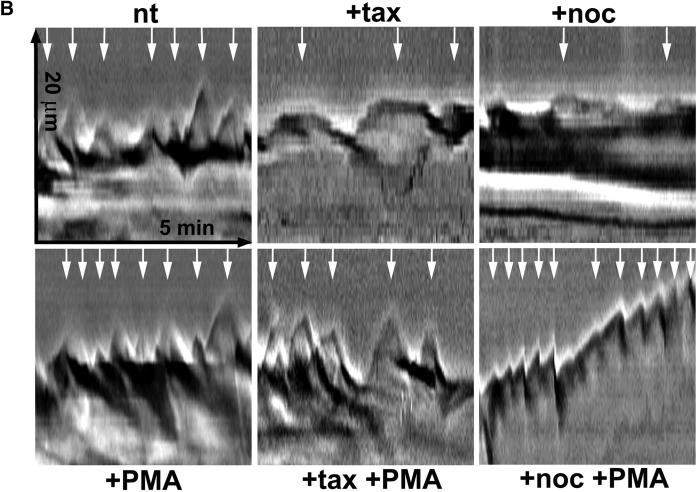
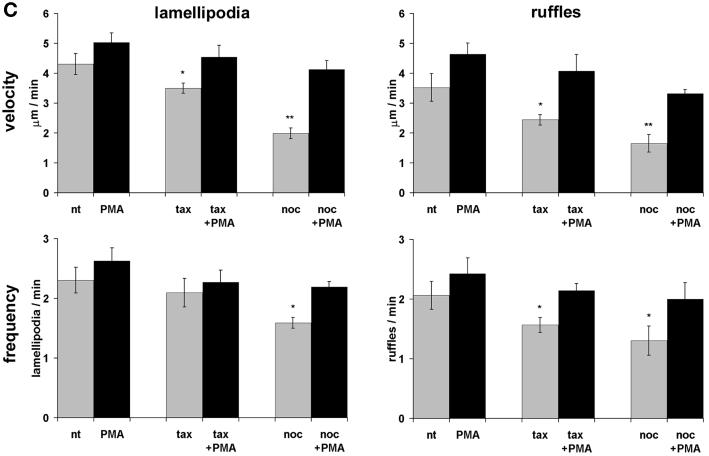
Kymograph analysis. (A) Motility of B16 melanoma cells was analyzed by measuring cell edge movements along regions of interest (insert, white line). Movements at these regions (20-μm line) were recorded in 1-s intervals for a period of 5 min. Pictures were assembled resulting in a stroboscopic image, which displays lamellipodia protrusion (black lines) and ruffle retraction (white lines). Lamellipodia protrusion velocity and ruffle retraction rate in these time/space images are indicated by the ascent (dx/dt, μm/min) of protrusive or retracted structures with notable gray values; frequencies are measured counting the number of lamellipodia or ruffles per minute (1/period, min−1). (B) Stroboscopic images under different conditions. Taxol (+tax) and nocodazole (+noc) treatment for 60 min reduced velocity and frequency of lamellipodia protrusions and ruffle retractions. Protrusions and retractions are indicated by white arrows. Cell edge motility was enhance by PMA (+PMA); stimulation with PMA restored the motility of cells that were pretreated with taxol (+tax +PMA), or nocodazole (+noc +PMA). (C) Quantification of B16 cell motility by kymograph analysis. B16 melanoma cells were left untreated (nt) or were treated with taxol (tax), nocodazole (noc), or/and stimulated with PMA. Cell motility was recorded by SACED. The following cell motility parameters were quantified from stroboscopic images: 1) lamellipodia protrusion velocity, 2) ruffle retraction velocity (retraction rate), 3) lamellipodia frequency, and 4) ruffle frequency. Compared with nt cells, noc and tax decreased cell motility. Stimulation by PMA restored lamellipodia and ruffle velocity and frequency of cells pretreated with taxol (tax +PMA) or nocodazole (noc +PMA). At least 15 cells were analyzed per experimental condition. Error bars indicate SD of mean values, calculated from five independent experiments. p ≤ 0.01, p ≤ 0.001 compared with untreated control B16 cells..


