
FIGURE 1.
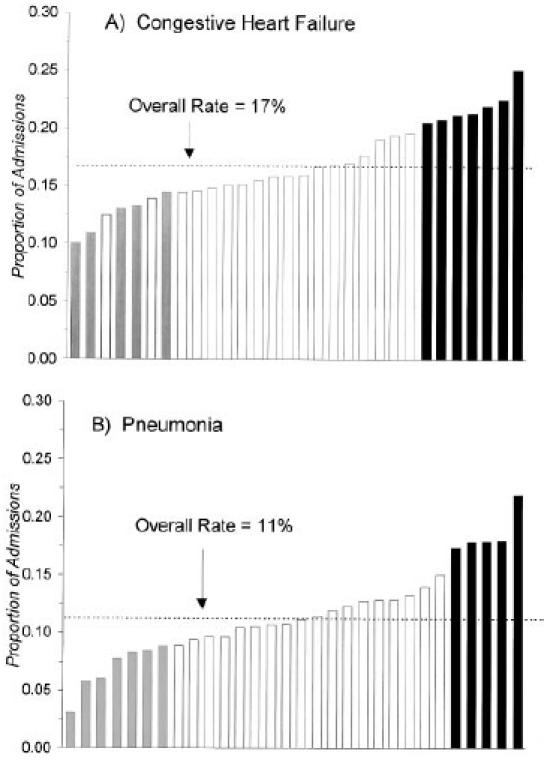
Proportions of low-severity admissions(i.e., predicted risk of death <1%)in individual hospitals for congestive heart failure (A) and pneumonia (B). Hospitals with rates significantly (p < .01) lower or higher than the overall sample rate are indicated by the gray and black bars, respectively