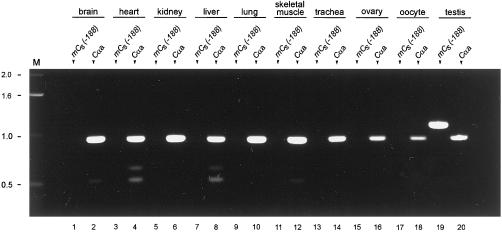
Figure 5.
Detection of Cα1 and Cs mRNA in murine tissues. RT-PCR of total RNA from various murine tissues. The forward primers used to generate the PCR products are shown at the top of the lanes: mCs(−188) to amplify Cs and Cαa to amplify Cα1. The reverse primer in all cases was CαeR. These primer sets are predicted to yield PCR products of 949 bases for murine Cα1 and 1119 bases for murine Cs. The PCR products were subjected to electrophoresis in an 0.8% agarose gel and stained with ethidium bromide. Transcripts encoding the Cα1 isoform are present in all the tissues analyzed, whereas Cs transcripts are detected only in the testis. Lane M, DNA molecular mass markers (in kilobases).

