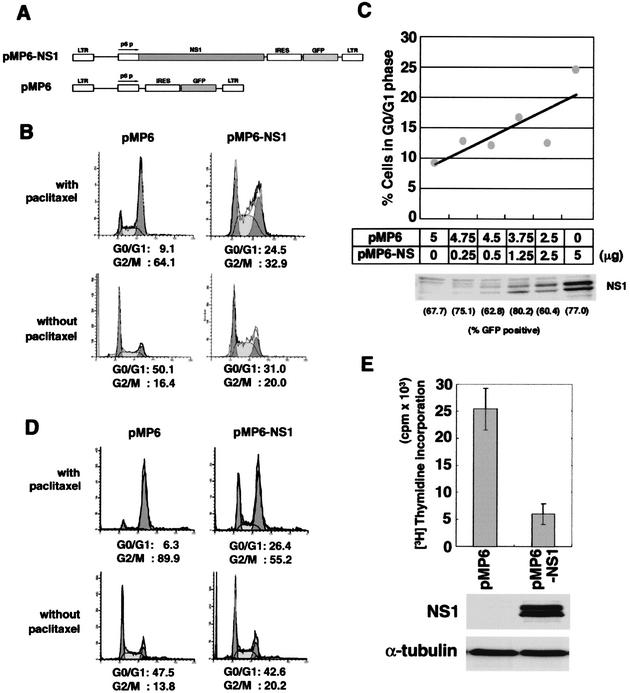
FIG. 4.
NS1 expression induces cell cycle arrest at the G1 phase. (A) Schematic structure of NS1 expressing and control vector constructs. UT7/Epo-S1 (B) or 293T cells (D) were transfected with pMP6 (left panels) or pMP6-NS1 (right panels) and incubated for 24 h. They were then treated (upper panels) or untreated (lower panels) with a mitotic inhibitor, paclitaxel, for 24 h. Subsequently, they were stained with PI for detection of DNA content and loaded onto a FACS caliber. (C) The percentages of UT7/Epo-S1 cells at the G1 phase were plotted after transfection of pMP6 and pMP6-NS1 plasmids at various ratios, and their NS1 expression levels were detected by Western blotting. (E) The transfected UT7/Epo-S1 cells with pMP6 or pMP6-NS1 plasmids were assayed for [3H]thymidine incorporation (upper panel). UT7/Epo-S1 cells were transiently transfected with 5 μg of the pMP6-NS1 or pMP6 plasmid by electroporation, and then the cells (105 per well) were cultured for 24 h and assayed for [3H]thymidine incorporation for the last 4 h of cultivation. The expression levels of NS1 and α-tubulin were detected by Western blotting with their specific antibodies (lower panels).

