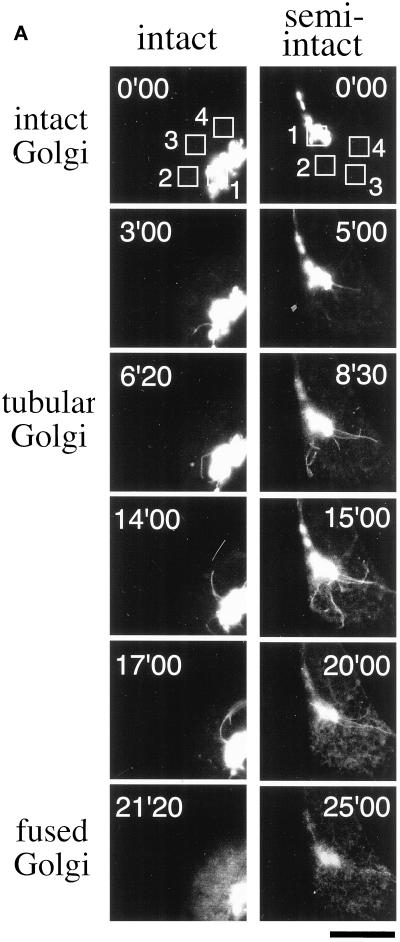
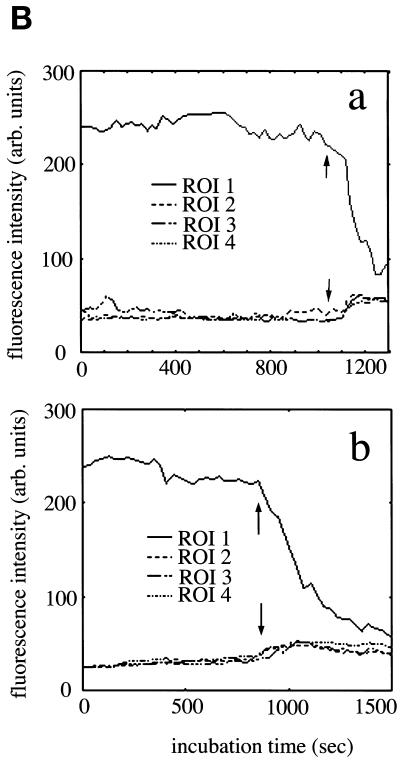
Figure 1.
The formation and subsequent fusion to the ER networks of Golgi tubules in intact and semi-intact CHO-GT cells. (A) Intact CHO-GT cells incubated with 10 μg/ml BFA were imaged at 5-s intervals with the use of a confocal microscope equipped with a time-lapse image-acquisition system at 30°C. Semi-intact CHO-GT cells incubated with 10 μg/ml BFA in the presence of cytosol and ATP were imaged as described in the text. The cells having intact Golgi, tubular Golgi, and fused Golgi are shown. Incubation times are indicated in each panel. Bar, 10 μm. (B) Fluorescence intensities associated with the Golgi ROI (ROI 1) and cytoplasm ROIs (ROIs 2–4) in the intact (a) and semi-intact (b) cells in Figure 1A are plotted at 5-s intervals for 20 or 25 min. Arrows indicate the approximate times of Golgi disassembly. There are corresponding increases in the fluorescence intensities of cytoplasm ROIs.


