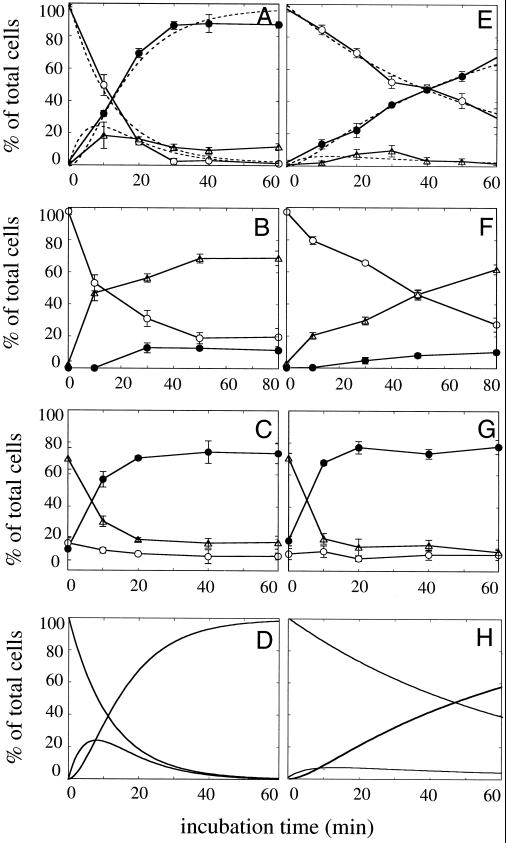
Figure 9.
Kinetics of each process of BFA-induced Golgi disassembly in nocodazole-untreated (A–D) and -treated (E–H) semi-intact CHO-GT cells. Intact CHO-GT cells were treated with nocodazole (2 μg/ml) as described in the text to depolymerize microtubules and then permeabilized by SLO. (A and E) Drug-untreated or -treated semi-intact cells were incubated with BFA/ATP/cytosol at 32°C for various periods, fixed, and then subjected to morphometric analysis (Golgi disassembly assay). Dotted lines indicate the simulation curves, which were simultaneously fitted to the data plots according to the successive reaction model shown in Figure 10. (B and F) The cells were incubated with BFA/ATP/NEM-treated cytosol at 32°C for various periods and then analyzed as described above (Golgi tubule formation assay). (C and G) The cells were incubated with BFA/ATP/NEM-treated cytosol at 32°C for 60 min to generate the Golgi tubules. After being washed, the cells were further incubated with BFA/ATP/cytosol at 32°C for various periods, fixed, and subjected to morphometric analysis (Golgi tubule fusion assay). The protein concentration of the cytosol used was 2.3 mg/ml. Three hundred cells were counted in three randomly selected fields for each time point. Three independent experiments were performed, and means and SDs were calculated. (D and H) Simulated curves for the Golgi disassembly process. With the use of the rate constants obtained from the Golgi tubule formation assay (B and F) and the Golgi tubule fusion assay (C and G), simulated curves for the Golgi disassembly process according to the successive reaction model were drawn. ○, intact Golgi; ▵, tubular Golgi; ●, fused Golgi.

