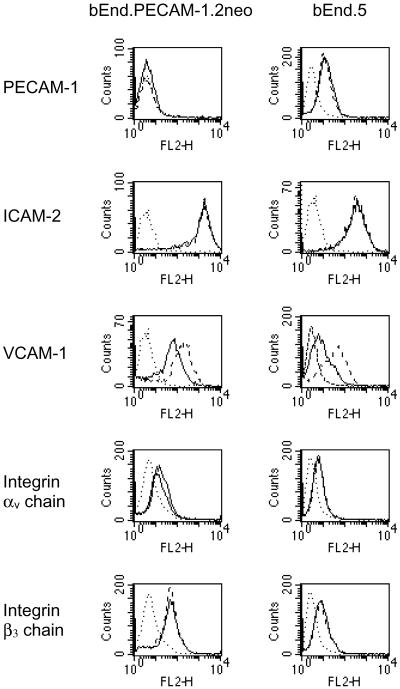
Figure 6.
Expression of cell surface molecules on bEnd. PECAM-1.2neo and bEnd.5 cells. Surface expression of PECAM-1, ICAM-2, VCAM-1, integrin chains αv and β3 on nonstimulated (solid lines) and TNF-α stimulated (dashed lines) bEnd. PECAM-1.2neo and bEnd.5 cells were assessed by fluorescence-activated cell sorting. Dotted lines indicate the isotype matched negative control. The significant difference between the two cell lines is in their PECAM-1 expression.

