Figure 5.
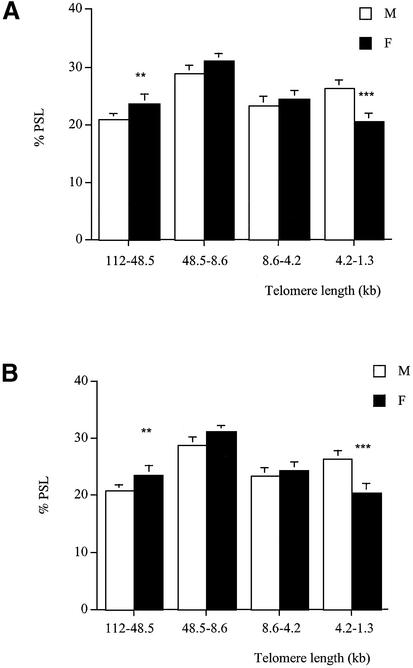
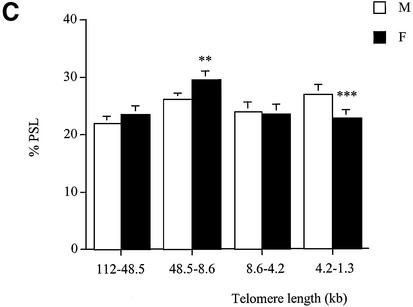
Telomere length analysis reflects gender differences at 15 months of age. Genomic DNA was extracted from (A) kidney, (B) liver and (C) pancreas of males (white columns) and females (black columns). Each telomere smear was divided into four regions according to a molecular weight marker: 112–48.5, 48.5–8.6, 8.6–4.2 and 4.2–1.3 kb. Arbitrary units (% PSL) were calculated for each size region. Values are means of n = 8 ± SEM. **P < 0.01 and ***P < 0.001 using the unpaired Student’s t-test.


