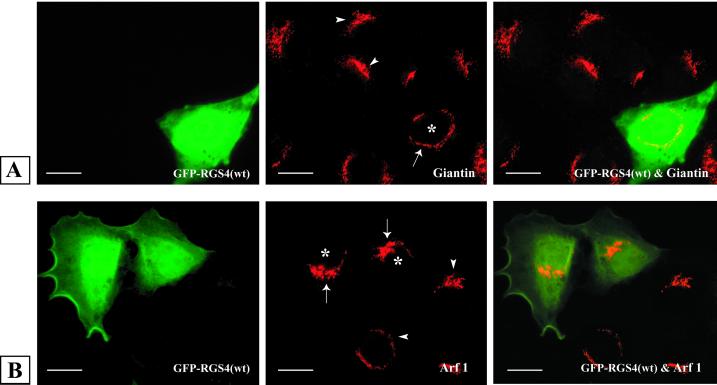
Figure 6.
Intact Golgi morphology in RGS4-expressing cells. LLC-PK1 cells were transiently transfected with plasmids encoding either GFP or GFP–RGS4 before staining with giantin (A) or ARF1 (B) antibodies and visualization by immunofluorescence microscopy. Left column represents GFP–RGS4-expressing cells; middle column shows endogenous giantin (A) or ARF1 (B) distribution; and right column is the merge of the two images in each row. Arrowheads indicate the Golgi region of nontransfected (control) cells, and arrows delineate the Golgi region of cells in the same culture transfected with GFP–RGS4 (wild type). Asterisks indicate the nucleus of GFP–RGS4 (wild type)-transfected cells (middle column). Bars, 5 μm.

