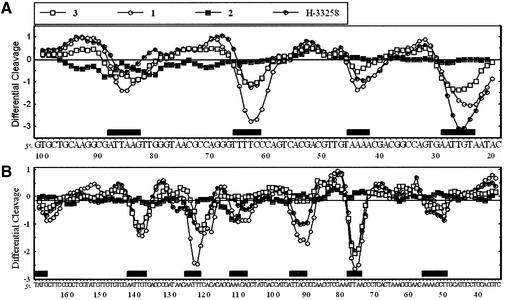
Figure 3.
Differential cleavage plots comparing the susceptibility of (A) the 117mer and (B) the 265mer pBS restriction fragments to DNase I cutting in the presence of the bis-benzimidazole compounds (2 µM each). Negative values correspond to a ligand-protected site and positive values represent enhanced cleavage. Vertical scales are in units of ln(fa) – ln(fc), where fa is the fractional cleavage at any bond in the presence of the drug and fc is the fractional cleavage of the same bond in the control, given closely similar extents of overall digestion. Each line drawn represents a 3-bond running average of individual data points, calculated by averaging the value of ln(fa) – ln(fc) at any bond with those of its two nearest neighbors. Only the region of the restriction fragment analyzed by densitometry is shown. Black boxes indicate the positions of inhibition of DNase I cutting in the presence of the drugs.

