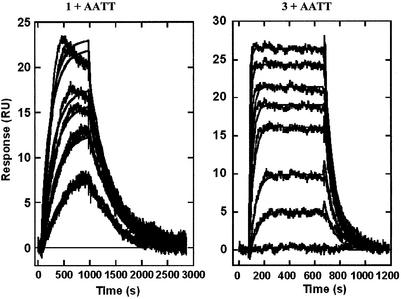
Figure 7.
BIAcore SPR sensorgrams for the complexes of compounds 1 and 3 with the AATT DNA minor groove in HBS buffer at 25°C. Both compounds bind strongly to the AATT sequence and reach saturation at concentrations below 500 nM. Global fitting of the curves to obtain association and dissociation kinetics constants was done with BIA Evaluation software and a single site interaction model (Materials and Methods). The best-fit lines through each experimental plot are also shown in the Figure and as can be seen, the global, single-site model provides excellent fits to all of the experimental curves. Similar fits with the other DNA samples provided the kinetics constants in Table 1.

