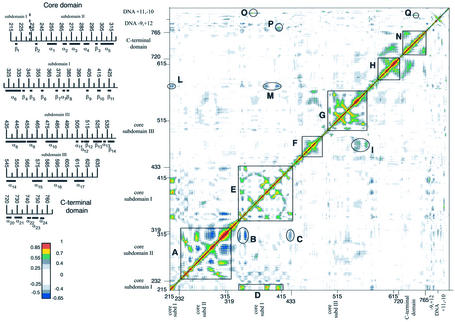
Figure 1.
DCC map for the topo I–DNA complex. Green, yellow and red points represent correlated values with 0.55 ≤ Cij < 0.70, 0.70 ≤ Cij < 0.85 and 0.85 ≤ Cij < 1, respectively (Cij is defined in Materials and Methods). Anti-correlation values –0.65 ≤ Cij < –0.50 are represented in blue. The correlation range 0 ≤ Cij < 0.55 and the anti-correlation range –0.50 ≤ Cij < 0 are represented in a grey scale depending on the absolute value of the correlation. The value 1, along the diagonal (correlation of the residue with itself), is represented in black. Secondary structure elements are shown in the left part of the figure.

