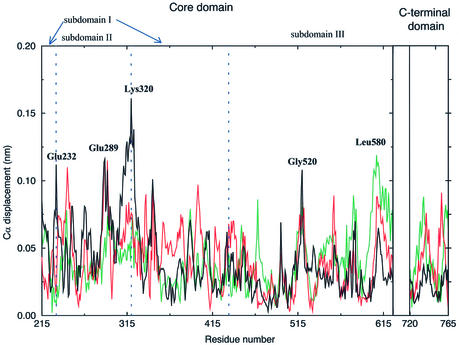
Figure 5.
Displacement of each topo I Cα atom along the three eigenvectors having the largest eigenvalues. The displacement along the first, second and third eigenvectors is represented with black, red and green lines, respectively. Residues with the largest displacements are labelled. The boundaries between the three core subdomains are marked with vertical dashed lines.

