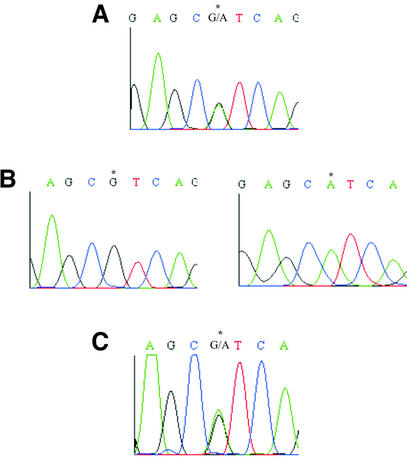
Figure 2.
(A) Electropherogram data of a candidate SNP discovered in brown trout by direct sequencing of a re-amplified AFLP band. (B) Electropherogram data of the homologous region in two clones derived from the re-amplified band shown in (A). (C) Electropherogram data of the candidate SNP region obtained by LSA and direct sequencing of the same individual as in (A). The position of the SNP is indicated by asterisks.

