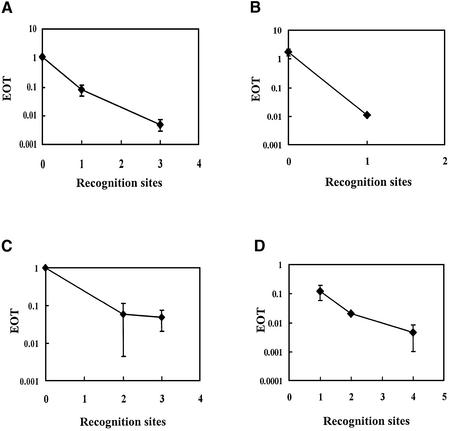
Figure 4.
Relationship between EOT and the number of recognition sequences present in plasmid DNA. Average EOT values are plotted against the number of recognition sequences for R-M systems EcoBI (A), EcoAI (B), EcoR124I (C) and HindIII (D). Average EOT values and standard deviations were calculated from the data shown in Table 1.

