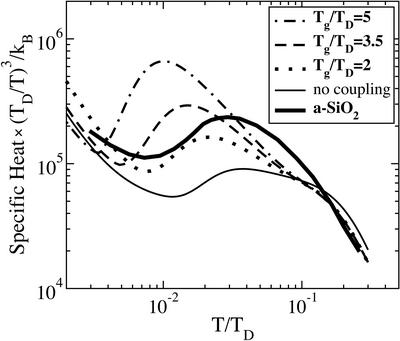
Figure 2.
The heat capacity per domain, which follows from the derived TLS + ripplon density of states, divided by T3. This includes the Debye contribution. The thin line neglects phonon coupling and has Tg/TD = 4. The experimental curve for amorphous silica from ref. 20, originally given in J/gK4, is shown multiplied by ℏ3ρc (6π2)(ξ/a)3/k
 , where we used ωD = (cs/a)(6π2)1/3, (ξ/a)3 = 200 (9), ρ = 2.2 g/cm3, cs = 4,100 m/sec, and TD = 342 K (3). By using the appropriate value of kBTg/ℏωD = 4.4 for a-SiO2 would place the peak somewhat lower in temperature than observed.

