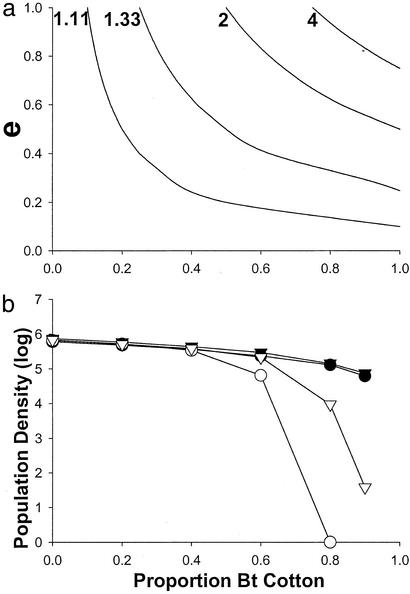
Figure 1.
Effect of Bt crop abundance on population density in a deterministic (a) and spatially explicit, stochastic (b) model. (a) Density decreases at values of emigration (e) and proportion of Bt cotton above and to the right of the curves associated with each value of Ro (net reproductive rate). Ro values are shown to the left of each curve. For example, with Ro = 1.11 and e = 0.2, density decreases if proportion of Bt cotton exceeds 0.5 (Eq. 5). (b) Density 3 years after deployment of Bt cotton. Declines in density were associated with reductions in insecticide sprays. F represents female daily fecundity and e represents adult emigration rate from natal fields. With e = 0.1, 10% of the moths emigrated mainly to contiguous fields. With e = 0.9, 90% of the moths dispersed up to four fields away. Symbols represent average population density for two simulations. Filled circles: F = 8, e = 0.1; open circles: F = 8, e = 0.9; filled triangles: F = 12, e = 0.1; open triangles: F = 12, e = 0.9.

