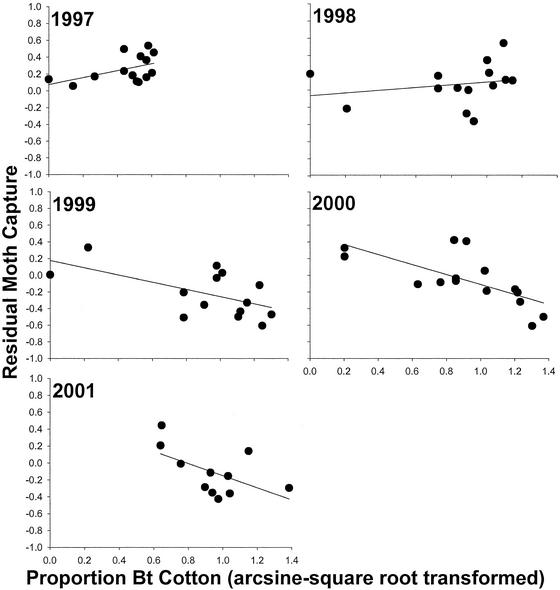
Figure 2.
Linear regression between regional proportion of Bt cotton (arcsine square root transformed) in a year and residual moth capture (see text) in the next year. Fewer than 15 regions were included in all years except 2000, because <10 pheromone traps had valid data in at least one of the regions. No data on cotton use in 2000 were available for the two regions with the lowest abundance of Bt cotton. Slopes and associated P values from 1997 to 2001 are, respectively: 0.41, P = 0.086; 0.16, P = 0.45; −0.43, P = 0.027; −0.60, P = 0.0037; and −0.71, P = 0.072.

