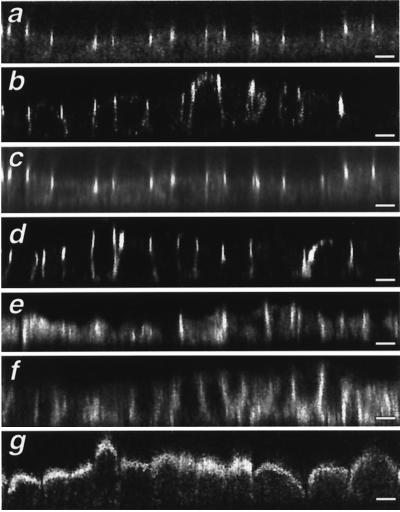
Figure 10.
Confocal microscopic analysis of the distribution of occludin, ZO-1, and PC in MDCK cells. X-Z sections (0.1-μm motor step) through parental MDCK cells (a, c, and e) and MDCK-PC8 cells stably expressing PC (b, d, f, and g). In both cases, occludin (a and b) and ZO-1 are restricted to junctions between adjoining cells; however, in cells expressing PC, the staining intensity of these TJ proteins between pairs of cells is more variable (b and d). The distribution of overexpressed PC (g) did not overlap that of occludin or ZO-1. Cadherin staining is more broadly distributed along the lateral cell surface extending more basally in MDCK-PC8 (f) than in parental cells (e). Bars, 10 μ m.

