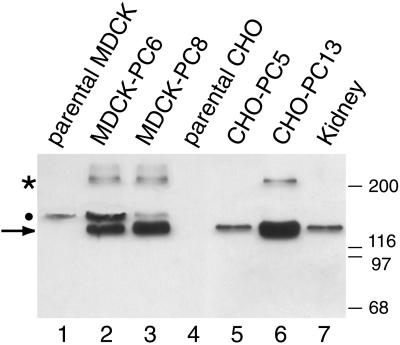
Figure 3.
Immunoblotting analysis of PC expressed in CHO-K1 and MDCK cells. PC (arrow) is expressed at high levels in stably transfected MDCK-PC8 (lane 3) and CHO-PC13 (lane 6) cells and at lower levels in MDCK-PC6 (lane 2) and CHO-PC5 (lane 5) cells. PC is seen as a 140-kDa band comparable to that found in rat kidney lysates (lane 7). PC is not expressed in parental CHO (lane 4) or MDCK (lane 1) cells. The 250-kDa band (asterisk), previously described in rat kidney (Dekan et al., 1991), most likely represents a dimer of PC. A nonspecific, 160-kDa band (dot) that cross-reacts with anti-PC serum (0601) is seen in nontransfected and transfected MDCK cells. Cells stably transfected with the pIRES-PC expression vector were lysed in TDU buffer, as described in MATERIALS AND METHODS. A total of 100 μg of cell lysate (lanes 1–6) or kidney lysate (lane 7) was separated by 7.5% SDS-PAGE and immunoblotted with anti-PC serum (0601). Markers indicate molecular mass in kilodaltons.

