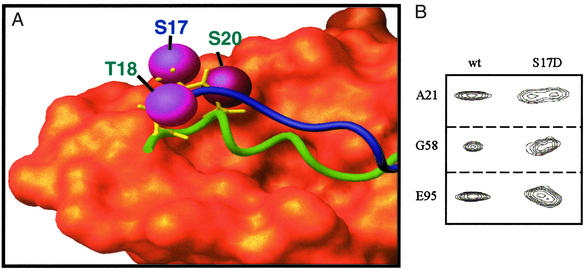
Figure 4.
(A) Superimposition of the x-ray crystal structure of p53–Mdm2 complex with a structure-based model of p53-free Mdm2. The Van der Waals surface for Mdm2 residues 25–109 from the crystal structure is orange. Green and blue tubes show the p53 peptide (from the crystal structure) and p53-free Mdm2 residues 16–24, respectively. In the crystal structure of the p53–Mdm2 complex, Mdm2 residues 17–24 are displaced by p53; there is no density for these residues. Magenta spheres indicate phosphorylatable residues on both p53 and Mdm2. Phosphate groups added to these residues have been shown to disrupt the p53–Mdm2 interaction. Note the close proximity of phosphorylatable p53 and Mdm2 residues. Rapid phosphorylation of p53-free Mdm2 followed by p53 phosphorylation of the p53 N terminus would make the displacement of the Mdm2 lid difficult due to the close proximity of several phosphate groups. (B) Selected peaks from heteronuclear single quantum coherence spectra demonstrate that the lid regions of WT-MDM2 and Mdm2–S17D have different affinities for the p53-binding site. Doubling of the peaks indicates two distinct conformations that interconvert on a long, slow time scale.

