Figure 3.
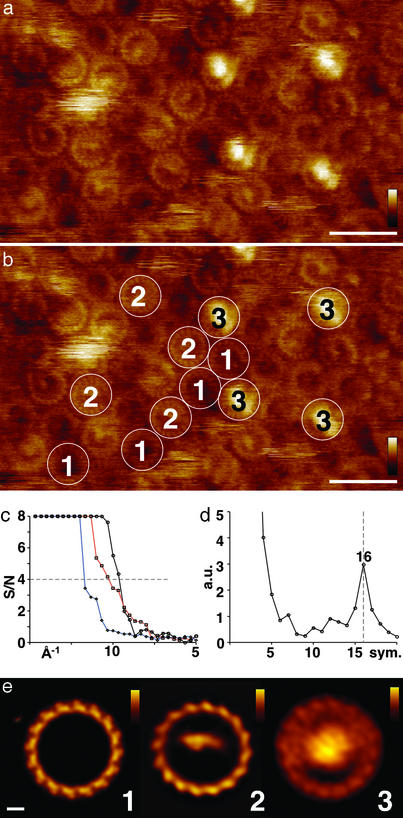
High-resolution AFM of the R. viridis core complex in native membranes. Three classes of complexes are imaged and averaged: 1, LH1; 2, RC–LH1; and 3, 4Hcyt–RC–LH1. (a) High-resolution AFM topograph. Some complexes reveal subunit structure of the LH1 in the raw data. (Scale bar, 20 nm; vertical false-color scale bar, 5 nm.) (b) Outline of four complexes each, classified to classes 1–3. (c) Calculation of the resolution limit of the topographs of the three classes as shown in a and b. Spectral signal-to-noise analysis plot from single-particle analysis (signal/noise = 4 was used as resolution cutoff): 1, black line connecting ○; 2, red line connecting □; and 3, blue line connecting ⋄. (d) Average rotational power spectrum over a radius ranging from 35 to 65 Å (top ring radius ≈50 Å) from 51 empty LH1 rings revealing 16-fold symmetry. (e) Average topographs of the three different complexes: 1 (16-fold symmetrized), 2, and 3. (Scale bar, 2 nm; vertical false-color scale bars: Left, 1 nm; Center, 1.5 nm; Right, 5 nm.)

