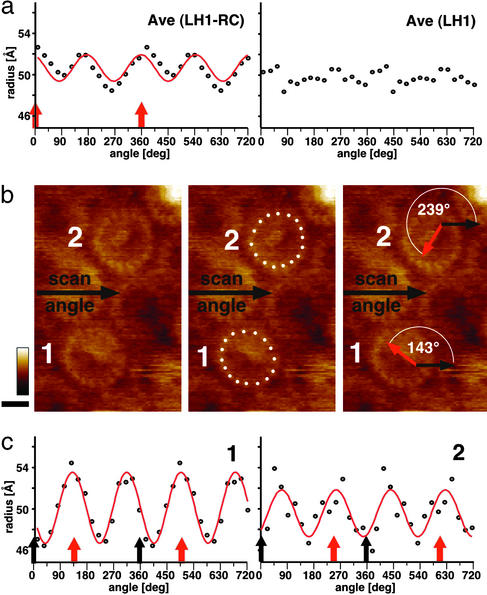
Figure 4.
Ellipticity analysis of LH1 of the native R. viridis core complex. (a) Polar coordinates plots of the LH1 subunit distribution of the RC–LH1 average (Left) and the nonsymmetrized LH1 average (Right). The center distances of the subunits are plotted against the angle as described in Methods. The red line corresponds to the theoretical coordinates of an ellipsis (Left), and the flat distribution of values indicates a circular subunit arrangement (Right). The red arrows indicate the RC long-axis orientation (see also Fig. 3e Center). (b) LH1 subunit distribution and the RC orientation in two core complexes. (Left) Raw data image. (Center) LH1 subunit distribution. (Right) Relative orientation of the RC with respect to the scan angle. Black arrows, atomic force microscope scan angle; red arrows, RC long-axis orientation. (c) Polar coordinates plots of the two core complexes shown in b. Red lines, theoretical ellipsis fits; black arrows, atomic force microscope scan angle; red arrows, RC long-axis orientation.

