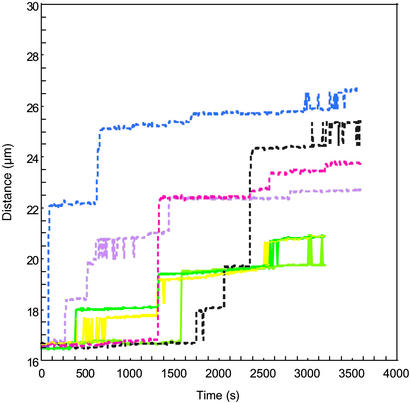
Figure 3.
Measured distance between the centers of the magnetic beads tethered to the surface of the glass capillary by different identical DNA molecules as a function of time. The solid lines represent trajectories for beads with 15 pN of applied force, and the dashed lines represent trajectories for beads with 20 pN of applied force.

