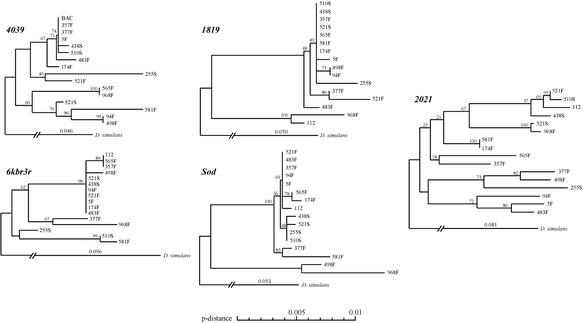
Figure 3.
Neighbor-joining trees of 4039, 1819, 6kbr3r, Sod, and 2021. The trees are based on pairwise differences per site (p-distance), excluding positions with gaps in any one of the D. melanogaster lines. Bootstrap values are shown at the nodes, based on 1,000 replications. D. simulans branches were added by using the average values of K (Table 3) (shown above the D. simulans branch).

