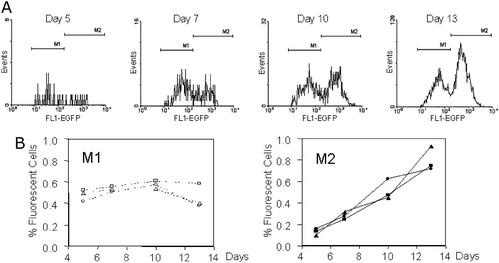
Figure 4.
M1 and M2 are distinct populations. Sorted HCT116 cells were analyzed after 5, 7, 10, and 13 days of culture, and EGFP histograms (A) were generated as described (Fig. 3). At days 5 and 7, the M1 population was larger than M2. At day 10, both populations were approximately equal in size, and at day 13 the M1 population was smaller than M2 (note the different scale of the y axis). M1 and M2 data were expressed further as percentage of R1 and plotted for each time point (B) and for each of three different HCT116 cell clones (A1.3, circles; A2.1, squares; A2.3, triangles). The M1 population showed little change (average proportion of fluorescent cells: 0.51%; 95% confidence interval 0.47–0.55%), and the M2 population accumulated over time. Each data point represents the mean of quadruplicate wells.

