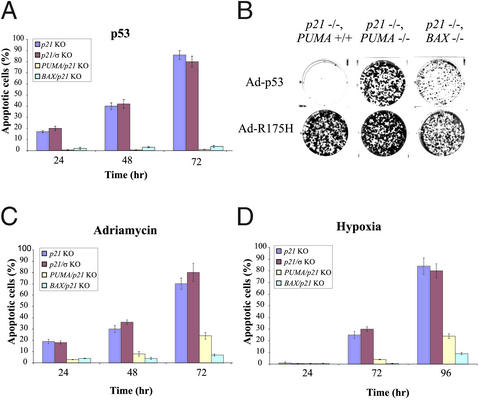
Figure 2.
Apoptosis induced by p53 and hypoxia. (A) Cells of the indicated genotypes were infected with Ad-p53 for the times shown on the x axis. The fraction of apoptotic cells was assessed by fluorescence microscopy of DAPI-stained cells. The means and standard errors of the mean are illustrated. (B) Cells were infected with Ads encoding WT (Ad-p53) or mutant p53 (Ad-R175H) and then seeded in six-well plates. Attached cells were stained with crystal violet 14 days later. (C) Cells of the indicated genotypes were exposed to adriamycin for various periods and scored as in A. (D) Cells of the indicated genotypes were exposed to hypoxic conditions for various periods and scored as in A.

