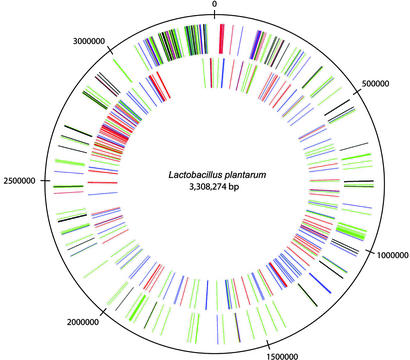
Figure 2.
Nonrandom distribution of genes belonging to specific functional categories in the L. plantarum chromosome. The outer circle contains all genes encoding proteins involved in sugar transport (PTS are colored black, other transporters are colored blue), sugar metabolism (green), and biosynthesis and/or degradation of polysaccharides (red). The inner circle contains all genes predicted to encode secreted proteins; see also Table 1. Red, signal peptides; green, N-terminal lipoprotein anchor; blue, N-terminal signal anchor sequence.

