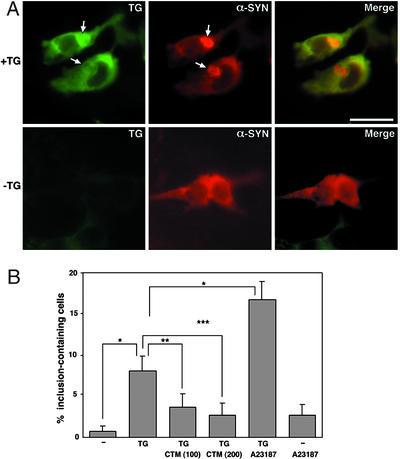
Figure 5.
α-Synuclein aggregates are detected by immunocytochemistry. (A) HEK293T cells were transfected with α-synuclein in the absence or presence of tTGase expression vector, and cells were formalin fixed 48 h posttransfection. α-Synuclein stains with red fluorescence, whereas tTGase stains green. (Upper) Distinct α-synuclein aggregation (arrows) in cells overexpressing tTGase. (Lower) Cells with diffuse cytoplasmic localization of α-synuclein and no detectable tTGase. (Scale bar: 20 μm.) (B) Cells transiently transfected with α-synuclein in the absence or presence of tTGase were treated with CTM (100 or 200 μM) or A23187 (0.1 μg/ml) for 48 h and stained for α-synuclein and tTGase. Aggregate-containing cells among transfected cells were counted in 10 randomly selected fields. Each microscopic field had 10–20 transfected cells. The data represent means ± SEM. Significance levels determined by factorial ANOVA and the Bonferroni post hoc test are shown. *, P < 0.002; **, P < 0.06; ***, P < 0.02.

