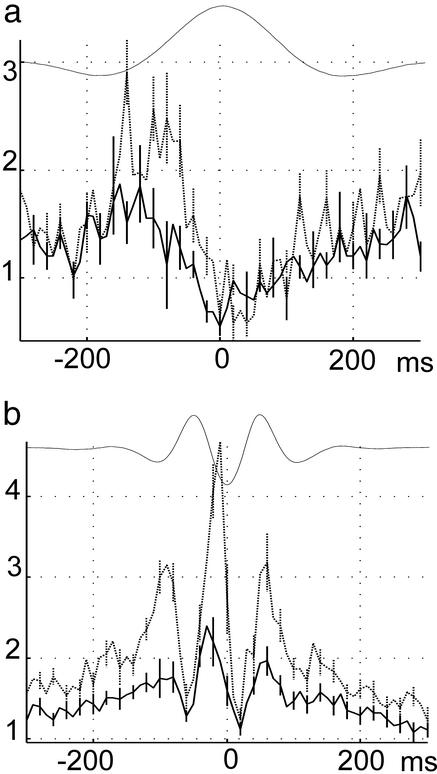
Figure 3.
Group data of fine time scale relationship between neocortical and hippocampal activity. (a) Cross-correlogram between delta waves and CA1 hippocampal unit activity (solid) and between delta waves and ripple troughs (dotted; mean ± SE). Highest probability of neocortical discharge occurred at the trough of delta waves (not shown). Note peak probability of hippocampal unit activity and ripple occurrence after the trough of delta wave. (b) Cross-correlogram between troughs of sleep spindles and CA1 hippocampal unit activity (mean ± SE; solid) and between troughs of sleep spindles and ripple troughs (dotted). Data are from 10 mice. Ordinates: c.i.

