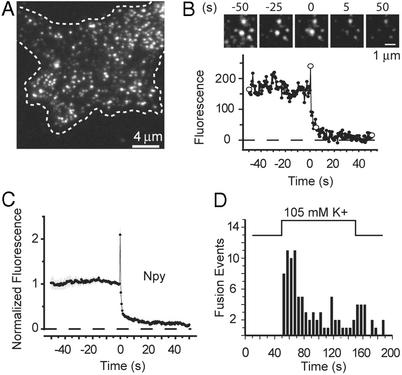
Figure 1.
Exocytosis of single NPY–EGFP-labeled granules. (A) Evanescent-field micrograph of the footprint of a live PC-12 cell (dashed line) expressing NPY–EGFP. (B) A single NPY–EGFP-labeled granule undergoing exocytosis (Upper) and the fluorescence at the granule site (Lower). Open circles refer to the images shown. There is a strong fluorescence increase lasting for a single frame; this transient increase defines the moment of fusion and the time origin. Traces as shown in B were aligned to the moment of fusion and normalized to the intensity at the granule site during the last 2 s before fusion. (C) The results then were averaged (43 events, four cells). (D) The number of fusion events in 5-s intervals is plotted against time after raising [K+] (96 events, eight cells).

