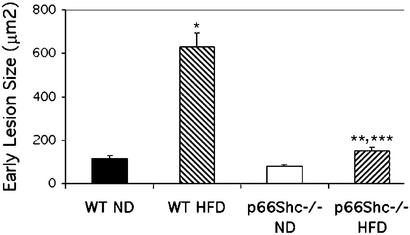
Figure 1.
Computer-assisted image analysis of aortic atherosclerotic lesion areas in p66Shc−/− and WT mice after chronic treatment with 21% HFD. *, P < 0.00001 vs. WT (ND); **, P < 0.05 vs. p66Shc−/− (ND); ***, P < 0.0001 vs. WT (HFD). Results are expressed as the mean ± SEM of lesions from 10 animals in each group.

