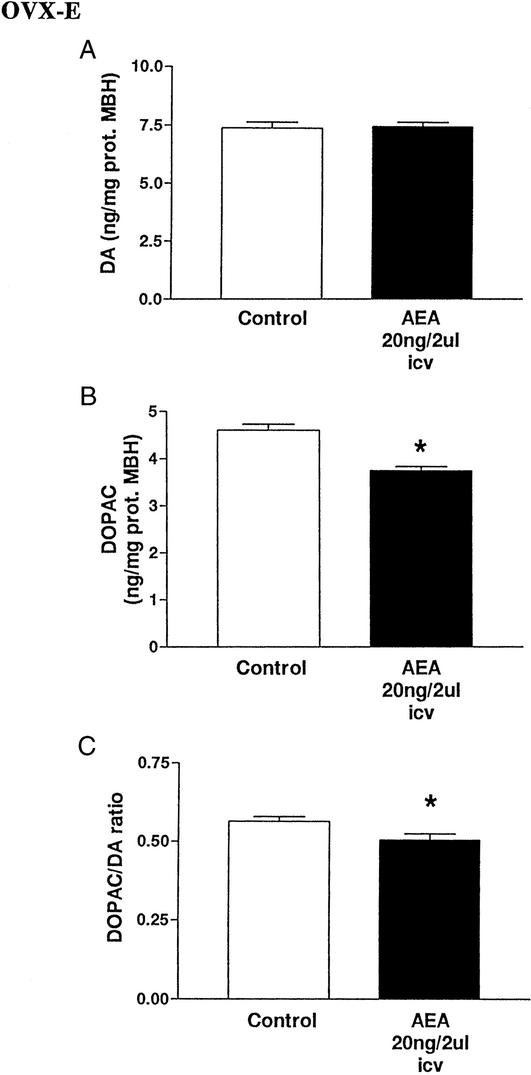
Figure 7.
(A) Effect of AEA (20 ng/2 μl) or 2 μl of saline injected icv on DA content in MBH after 150 min (six MBH per group, Pns). (B) Effect of AEA icv (20 ng/2 μl) or 2 μl of saline injected icv on DOPAC content in MBH after 150 min. *, P < 0.05 vs. control (Student's t test, six MBH per group). (C) Effect of AEA (20 ng/2 μl) or 2 μl of saline injected icv on DOPAC/DA ratio in MBH after 150 min. *, P < 0.05 vs. control (Student's t test; six MBH per group).

