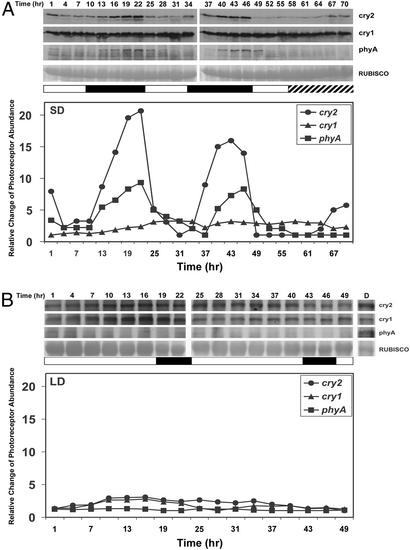
Figure 2.
Immunoblots showing photoperiod-dependent daily oscillation of cry2 and phyA protein abundance. Seven-day-old wild-type (Col-4) seedlings grown in SD (A; ≈130 μmol·s−1·m−2) or LD (B; ≈65 μmol·s−1·m−2) photoperiod were sampled at the times indicated, starting 1 h after dawn. Each immunoblot was probed with anti-CRY2, stripped, and reprobed with anti-CRY1 and then with anti-PHYA, as described (18). The ribulose-1, 5-biphosphate carboxylase/oxygenase (RUBISCO) large subunit shown as the Ponceau S-stained band is included as a loading control. White and black bars depict the light and dark period, respectively. Hatched bars represent the subjective dark period illuminated with light. Levels of CRY2 (●), CRY1 (▴), and PHYA (■) were first normalized against the total protein measured from the Ponceau S-stained membrane, and the normalized values were divided by the lowest value of same immunoblot (Upper) and shown as the relative change of photoreceptor abundance (Lower).

