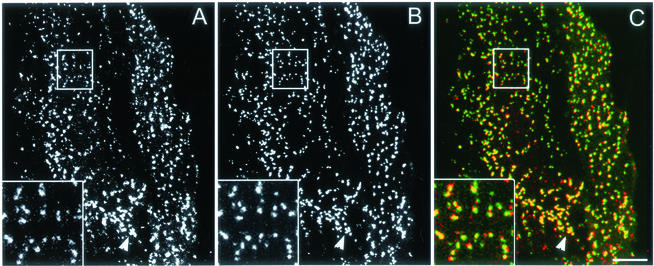
Figure 1.
Colocalization of clathrin and AP2 on the plasma membrane. Cells were imaged using CFP-clathrin and GFP-AP2 by using the 63× objective. (A) CFP-clathrin. (B) GFP-AP2. (C) Overlap between clathrin (red) and AP2 (green). The arrow points to an area of clustered pits. The insets show the distribution of clathrin, AP2, and overlap between clathrin and AP2. Bar, 9 μm.

